
Note: You need to set-up the pitch only in “Game” mode. In practice mode, you can skip that step as the pitch coordinates will not be taken into consideration.
Differences between Game and Practice
Game
- You need to set-up the pitch.
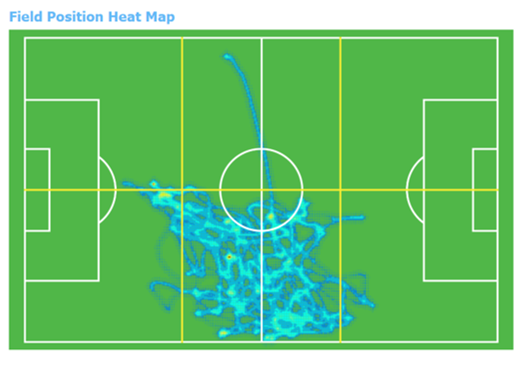
- The heat-map representing the position of the pitch is displayed in the “Individual Player” statistics and the main .pdf report.
- Only the measures that take place within the pitch (plus a buffer zone of 5 meters around the pitch) are taken into consideration for the statistics calculation.
- Example of Heat Map.
Practice
- You don’t need to set-up the pitch.
- No heat-map is displayed.
- All the recorded data during the selected time period are taken into consideration for the statistics calculation regardless of any pitch. E.g. ideal if you went jogging outside of a pitch area.
Tutorial
Pitch Set-up
Adjust the flag position to define the dimensions of the field for this session.
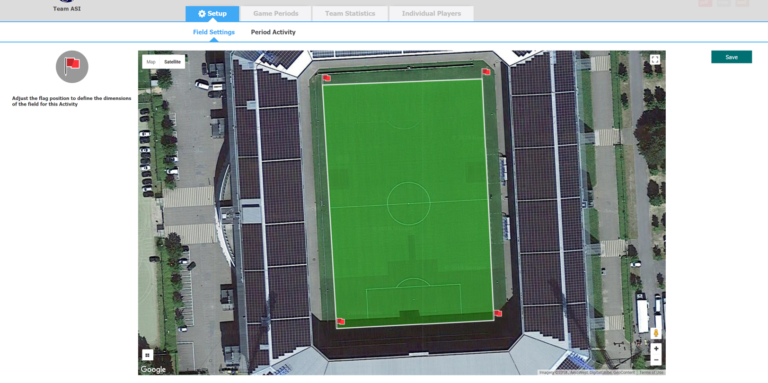
Click on Save.
Once saved, it moves to the next step Period Settings.
Note on precision
The precision of the pitch is dependent on “Google Map” precision. There could be a slight difference in the absolute precision.
It has no impact on the statistics’ precision as long as the recorded data are within a buffer of 5 meters..
The recorded data have a very high relative precision, statistics accuracy are not impacted. The only potential impact is in the Heat Map representation.